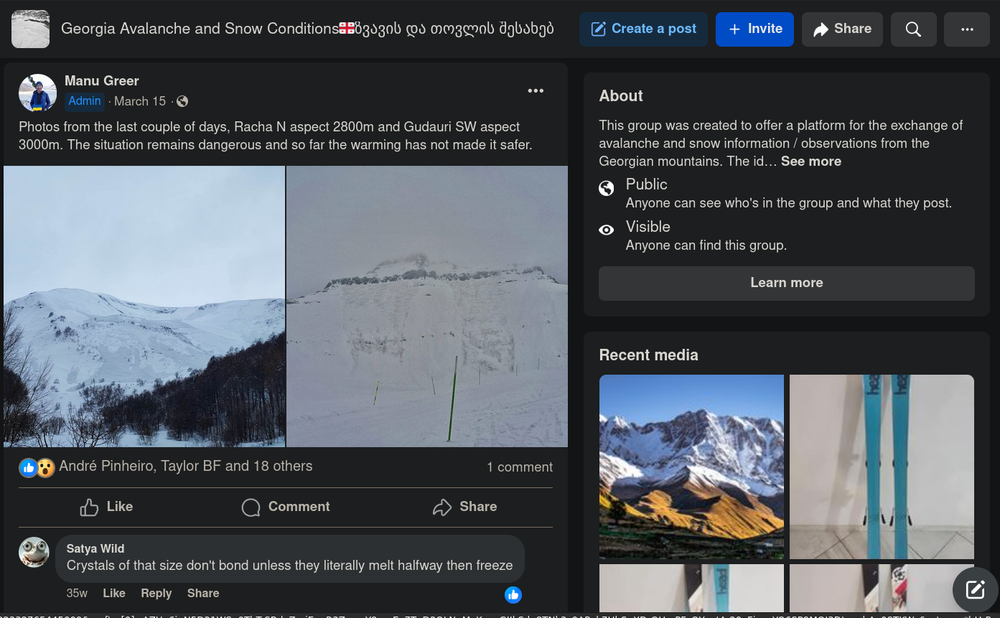
A new project was started in January 2022 in collaboration with members of the Georgia Avalanche and Snow Conditions🇬🇪ზვავის და თოვლის შესახებ community develop an avalanche forecasting system for Georgia. Specifically, I began to collaborate with Peter Schön, and Manu Greer, both avalanche professionals, we needed a platform to allow our small team of volunteers to produce and publish avalanche forecasts.
Research of the existing options was conducted, I eventually found some exisiting open source projects:
- ac-web (deprecated?)
- albina-euregio (hosted on https://avalanche.report)
I also had a conversation with a member of mountainsafetycollective.org with a potential offer to collaborate with them to use their platform based on squarespace, I didn't get too far along this track, I know squarespace has an ongoing subscription fee, and I was guessing that there would also be a fair amount of work involved to adapt it to the needs of our location and team.
albina-euregio seemed like the most promising project to adopt, it seems to be developed and adapted to the needs of the forecast regions it is serving, but if we had an allocated budget for paying someone to do the work to make it useful for Georgia, that's probably what we would have done, and maybe will do in the future. However with a budget of $0 with no interest for funding, and a deadline of "now" (season had already started), we had to rely on volunteer work and a desire to achieve minimum viable product, as soon as possible. Our volunteer workforce for development consisted of me, 1 person, who had only evenings and weekends available, while helping care for a newborn! As you can see our resources were, and remain extremely limited.
For my own part, launching into adopting a complex (but fantastic looking) project like albina-euregio felt too much like my usual work, and could potentially take many weeks or even months to produce something we could use for a forecast. It also has many components which need to be hosted, which rely on NodeJS (not exactly known for its slim resource consumption), and that hosting and associated maintenance needs to be paid for with our budget of $0. For motivation to remain high, I decided to "re-invent the wheel", and take a different approach.
I'm personally motivated by a desire to help this community and my love for Georgian mountains, people and culture. I also can see how a project like this could be useful for other communities which also lack the resources to develop their own comprehensive solution or to adopt the existing ones. With this in mind I intend to create a solution from the ground up with a goal to service multiple regions and languages, with minimal cost or effort required to deploy on the part of the users. It's also just fun to work on software projects like this which combine multiple interests, and has real-world applications. It can also serve as a test-bed for many ideas I have about how to improve avalanche forecasting in the future. I was also cognisant of the fact that if I were to leave the project due to other commitments or unforseen circumstances, it would be ideal if the rest of the team had something to fall back on or continue using in my absensce without requiring much technical knowledge to use or maintain.
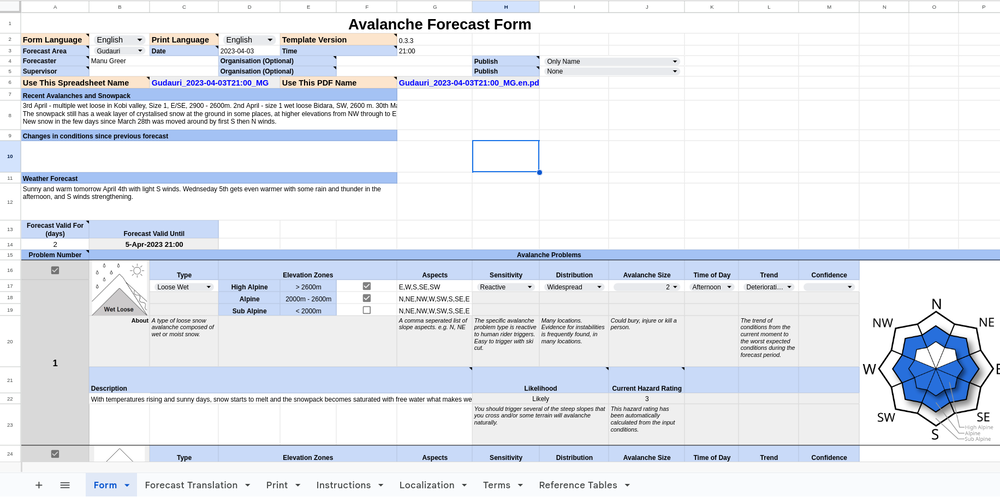
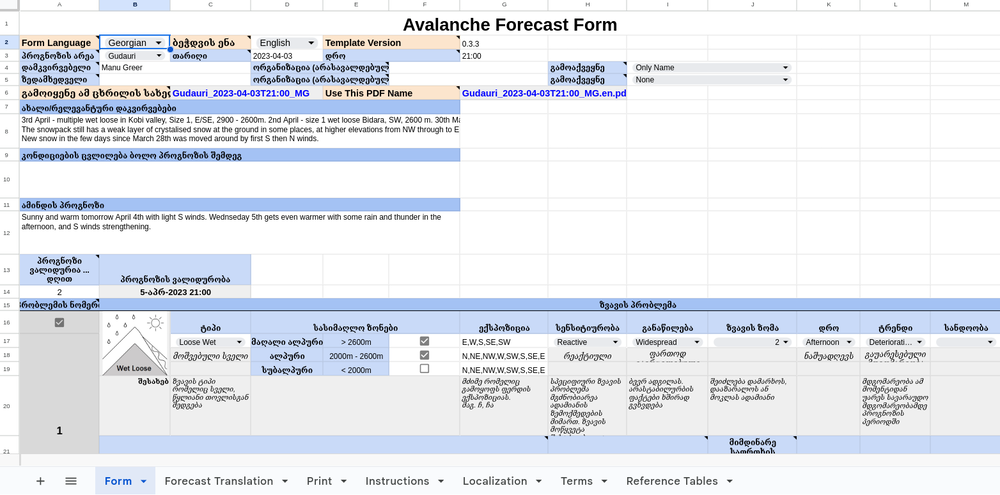
We started with the primary goal of minimum viable product in as short a time as possible. With the season already underway, and volunteers on hand ready to produce a forecast, time was of the essence! I knew that we needed to iterate quickly in order to establish our forms for entering data. The initial solution I produced was using Google Sheets, yes you heard it correct, a spreadsheet! This has the benefits that it's very fast to iterate, it's completely free, anybody can make contributions, or run it themselves without requiring any techninical knowledge, and it even has live collaboration features. In theory vendor lock-in is reduced with the possibility to export to spreadsheet file (in practice this isn't completely true due to the use of google sheets specific functions).
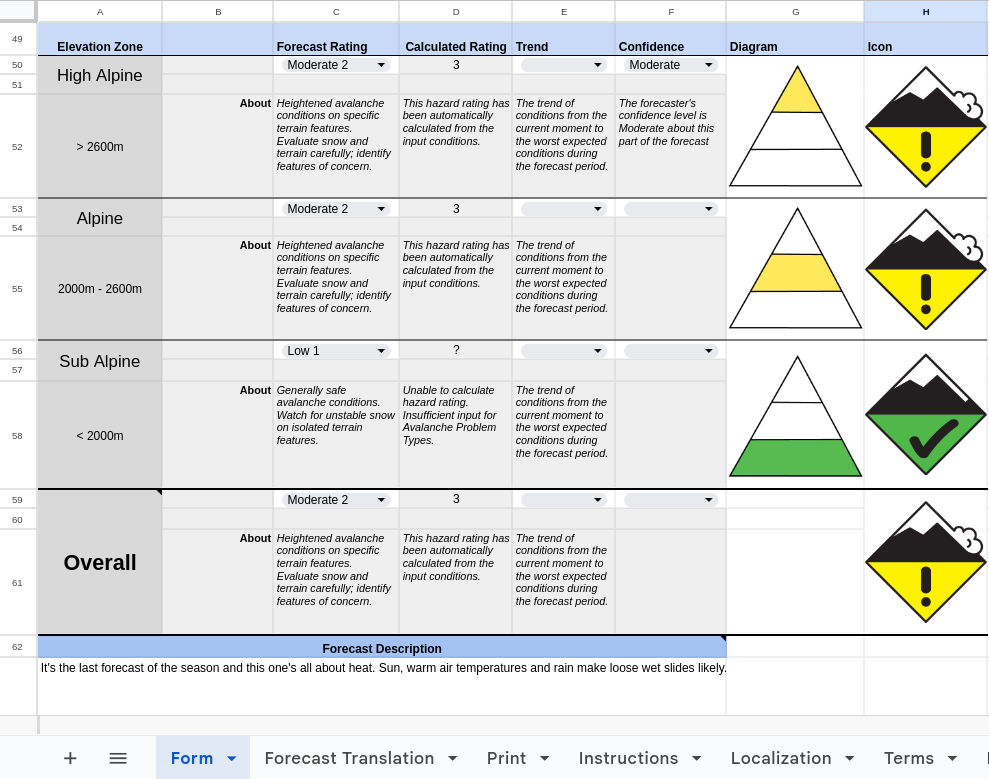
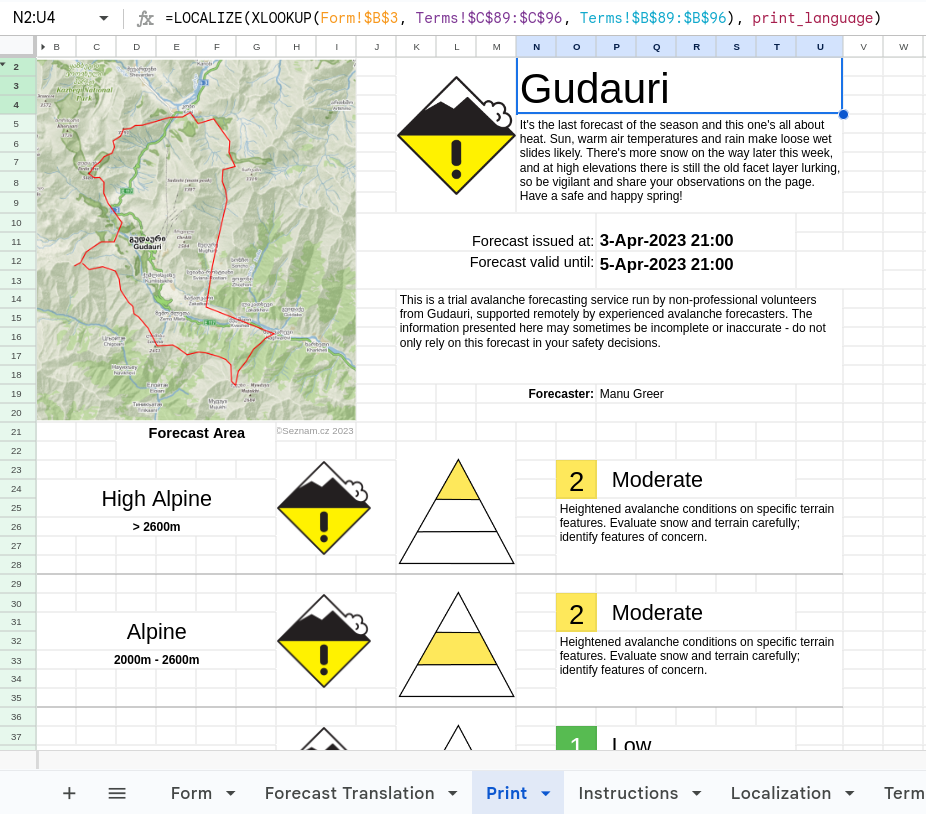
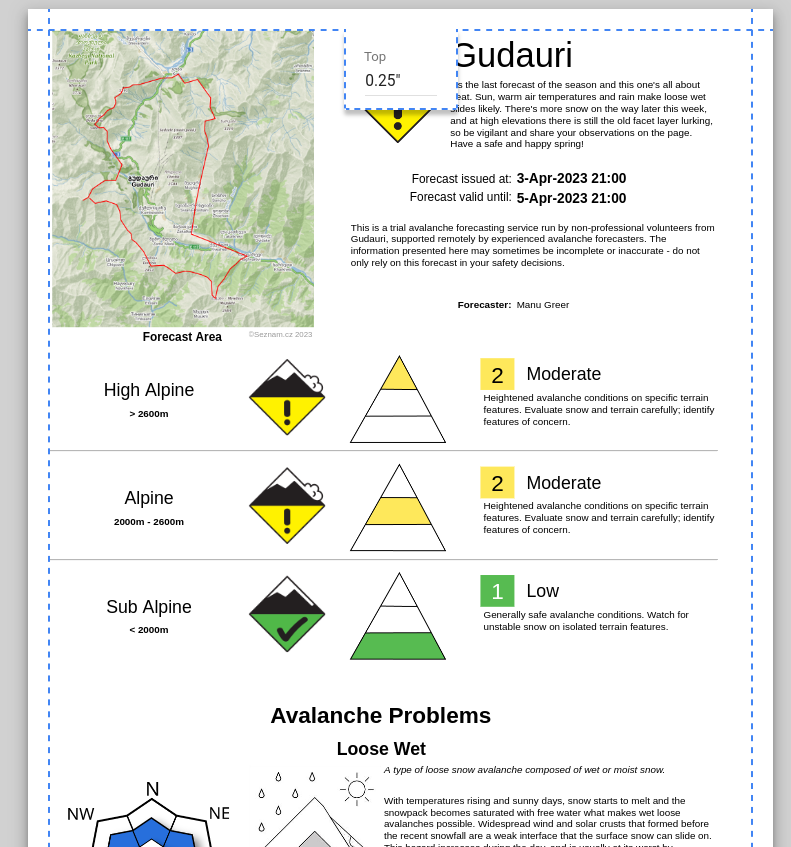
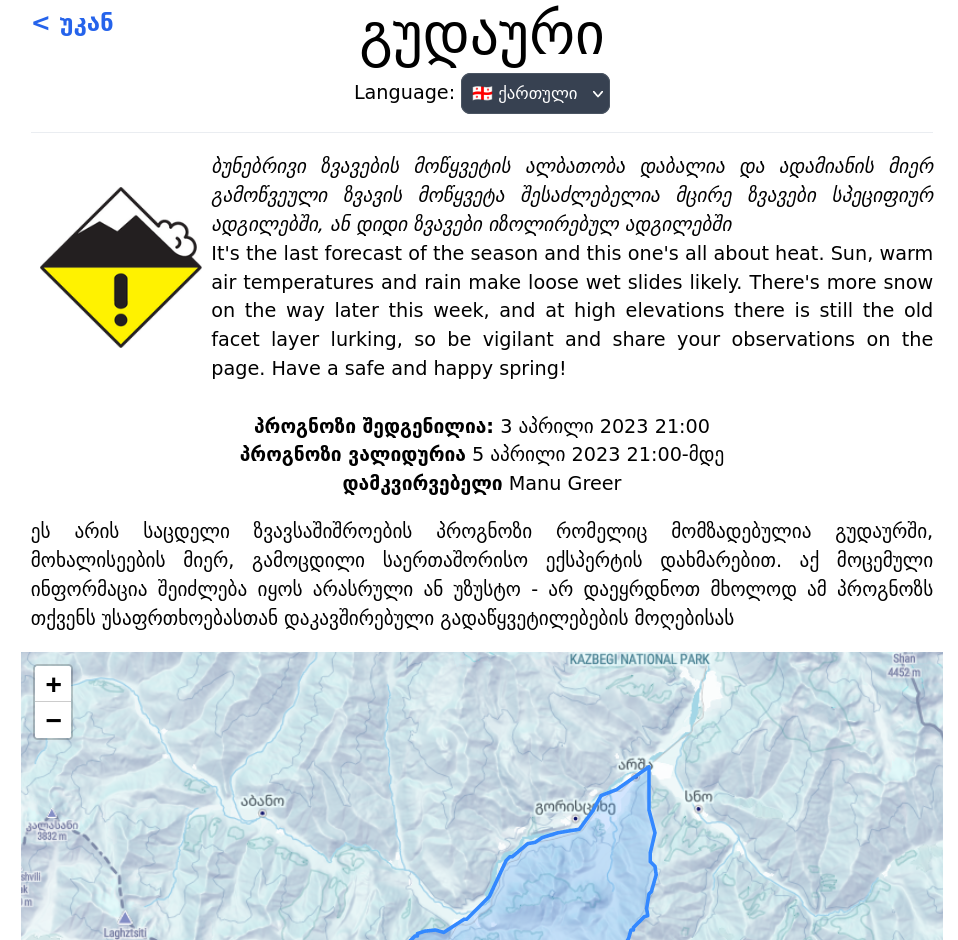
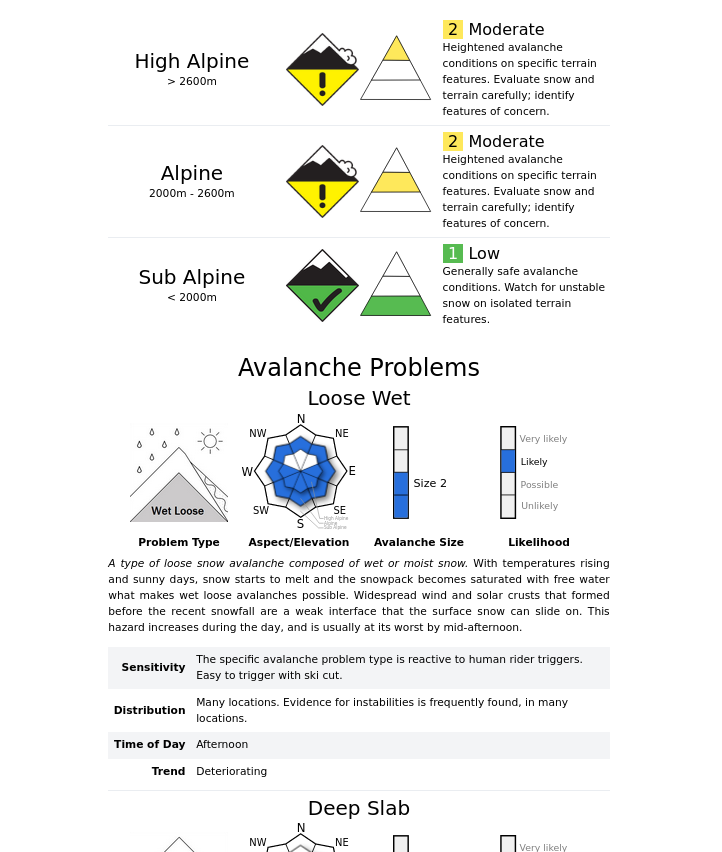
And so a mother of all avalanche forecasting spreadsheets, Avalanche Forecast Template was completed in a few weeks. It has localizations for English and Georgian, a sheet for producing the forecast and a sheet formatted for printing to PDF which we could share with our community on Facebook. It also has dynamically generated diagrams which were the inception for the software in this repository, which contains diagram rendering code in src/diagrams, which can render diagrams to png images to be embedded dynamically in the spreadsheet using the IMAGE function.
I chose to implement the diagram rendering server using Rust with a long view of using it for the entire project. It's what I use primarily for my professional work, and I have also implemented several other similar style personal projects (e.g. email-weather) with it. The language is well suited to reliable, self-contained software which uses minimal resources to run. It also offers an opportunity to access native libraries like GDAL for implementing interesting GIS related features in the future. There's something satisfying about crafting efficient systems from a climate perspective too! I realise this does place a barrier for entry for contributors over using something more popular like TypeScript/Javascript, but in my day job we are already migrating to Rust for all new projects or rewrites in preference to TypeScript it is going well!
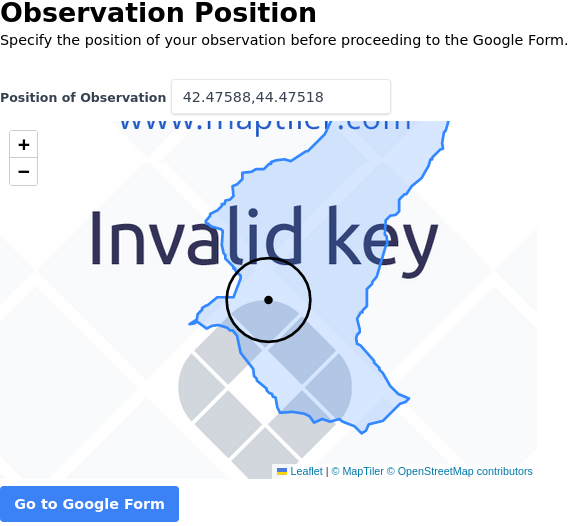
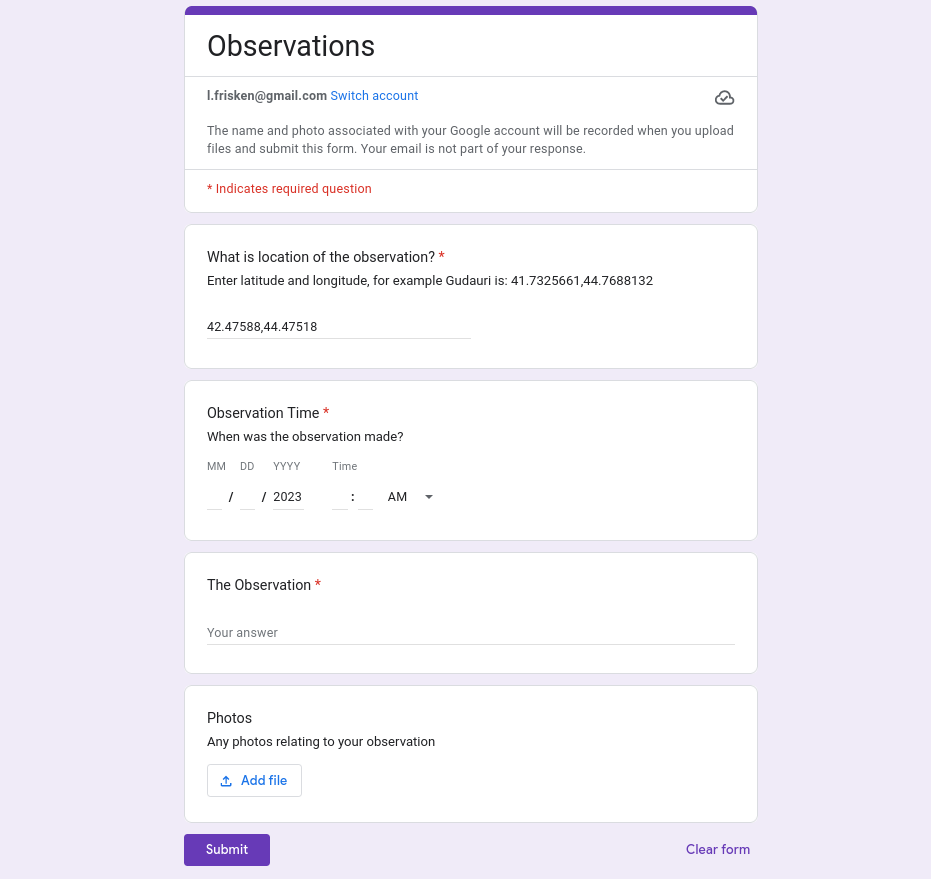
I also trialled creating an observation portal which used a map on the server to obtain position information and Google Forms for data submission (using pre-fill to send data from server to form). It's not really at a state of polish were I think it can be used yet.
Once we had a PDF version of the forecast working the first stage of the project was successful. I'm proud of what we managed to achieve with such limited time and resources, special thanks to Peter and Manu for their valuable input, and for Giorgi for helping us translate to Georgian! It was evident however that there were several problems with the spreadsheet approach that needed addressing:
- Forecasters were accidentally making edits which break the spreadsheet.
- This can be partially be addressed by locking cells, however when forecasters copy the template to create the forecast they can unlock them.
- Re-ordering the problem types is error-prone.
- Using the spreadsheet is more difficult than a website and probably requires more training.
- Producing the PDF is a multi-step process, and forecasters were forgetting to produce the Georgian version, even though that functionality is available.
- Formatting on the PDF was sometimes a bit wonky.
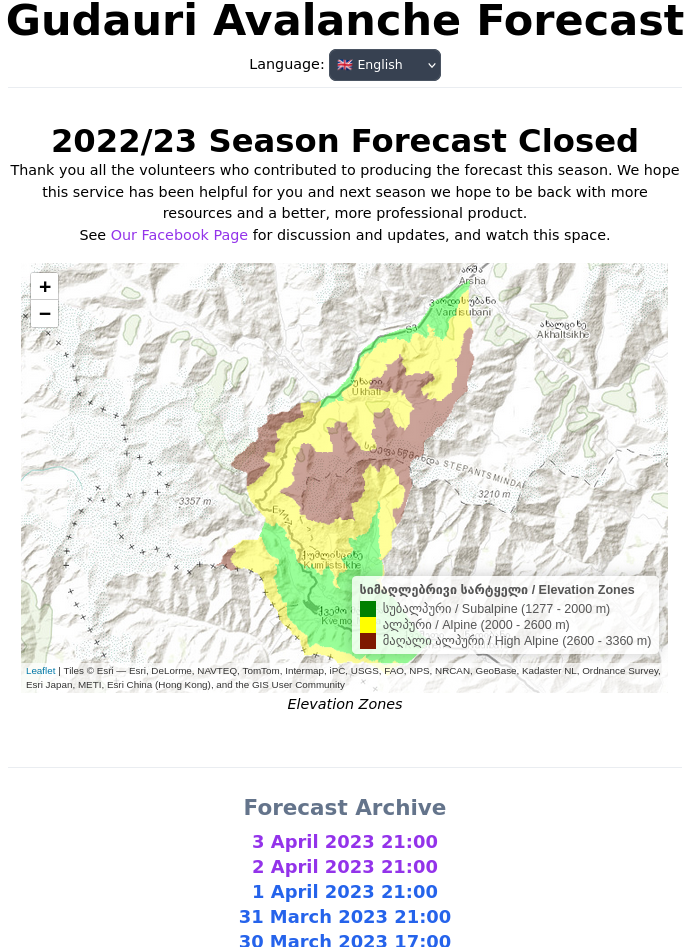
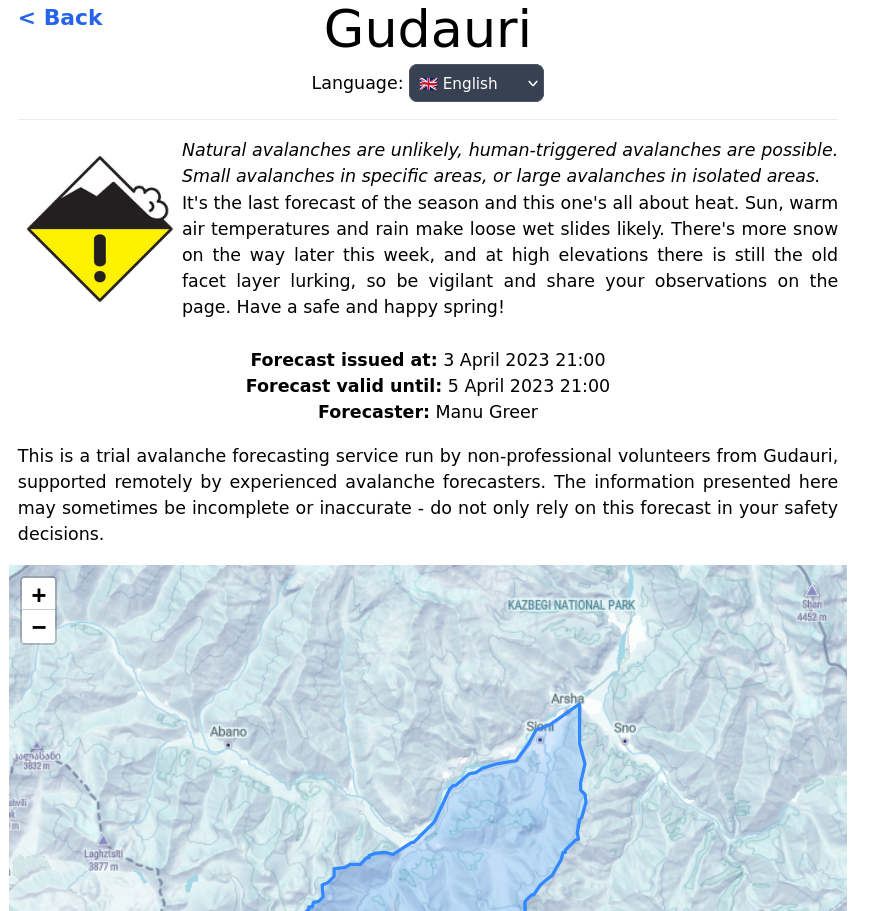
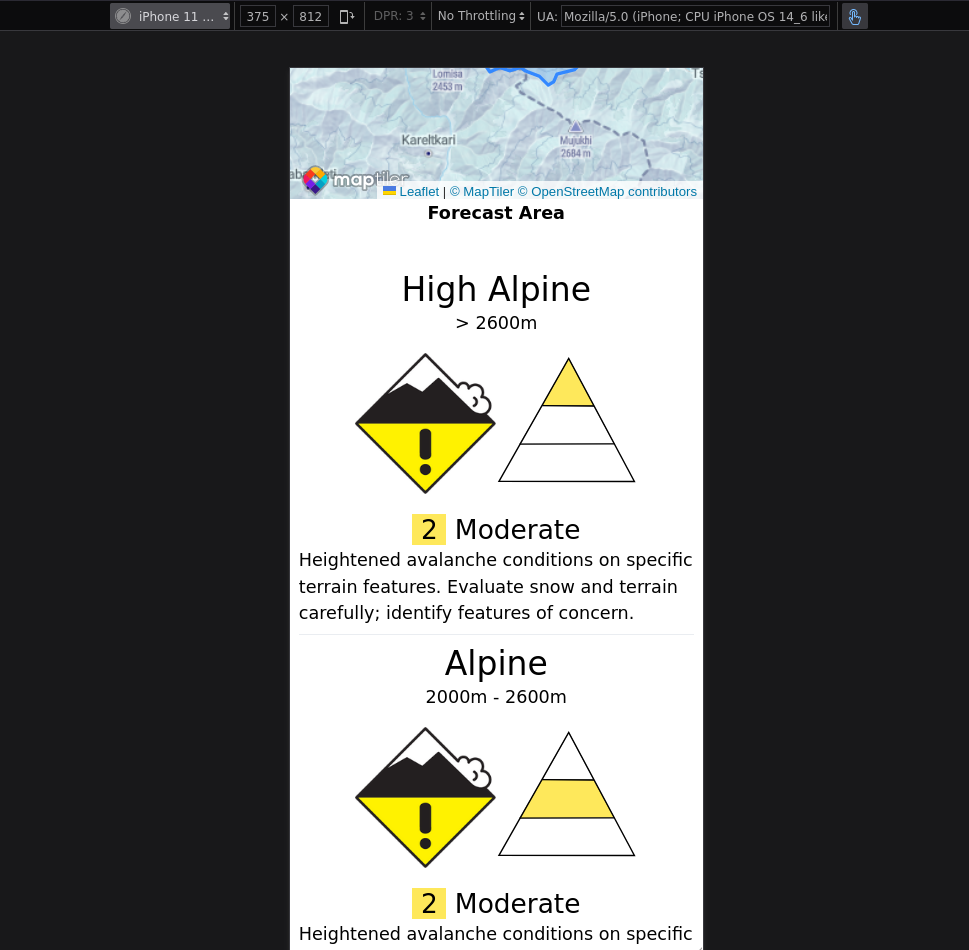
Most of the friction encountered was on the PDF generation, and sharing via Facebook posts. To this end I embarked on creating a website to replace this role. The first step was to have a way to share forecast PDF files on the website, so I created a "Published" folder in our shared google drive, where published forecasts can be placed, and this software would, when handling a request, fetch available forecasts and present them to the user on the index with links to download the PDF files. With the help of Peter we added a forecast area map which he created using R, along with highlighted forecast elevations for our home page. He also created a rendition of the forecast danger level per elevation which he was updating manually.
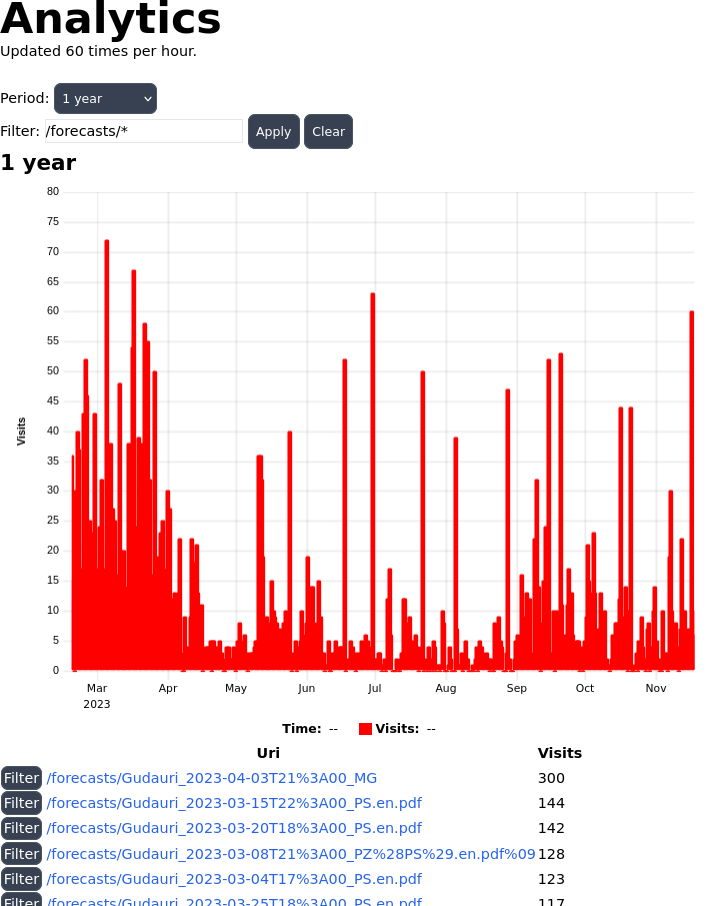
We wanted a way added some analytics collection capability so we could observe website traffic in relation to published forecasts (to get an idea on whether people were reading our forecasts), and I wanted to add some caching to avoid exceeding the Google Drive API request limits for downloading the forecasts. For this we needed a way to store information on the server. In keeping with the theme of small, lightweight, reliable and embedded, I chose to use sqlite as a database for the application to store this information. It should need no introduction, perhaps the most widely deployed piece of software on the planet, and again it has served us very well so far. We are unlikely to ever have the kind of traffic that would overload sqlite, especially when running it in WAL (write ahead log) mode.
Rust has a number of great tools for interacting with databases, I chose to use sea-query in combination with rusqlite via deadpool. The reasoning behind this was that while sqlx could probably fill this role perfectly too, I want to try something that would allow me to do a "find references" in my IDE on the columns on the database, to easily navigate the codebase and document the schema.
With all of this running, one may ask, what is the resource consumption on the server? Currently these are the statistics:
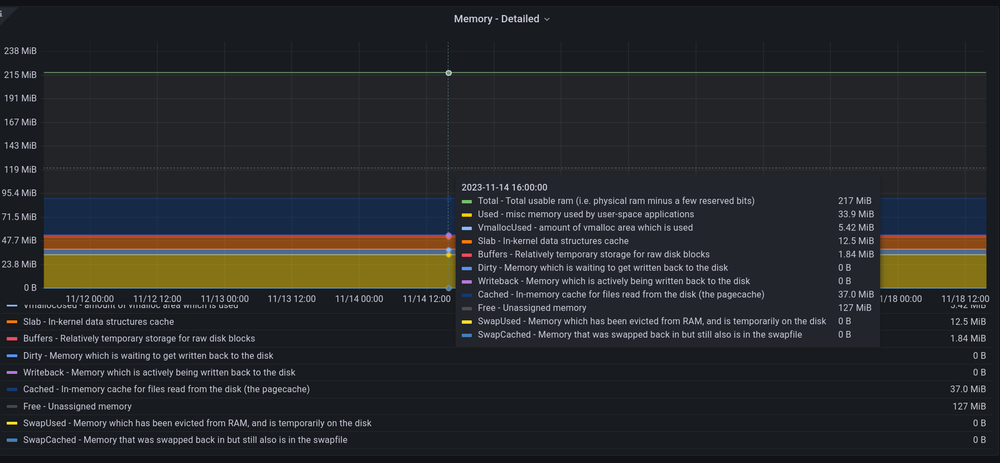
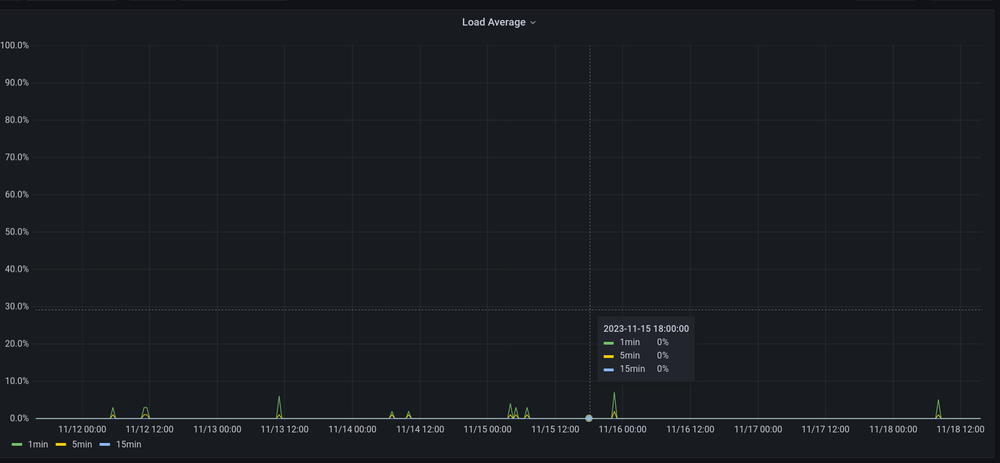
It looks like it's currently about 0% CPU and 34MiB for the application. Well, we don't have much traffic at the moment, but even during the season I was seeing a memory usage of 11MiB with less features enabled and a smaller binary. This is easily fitting within fly.io's free tier for hosting, without any effort put into optimizing, and will remain so for the forseeable future.
All of this served us well for the remainder of the season. With the first season over, we had some time over the Summer to work on the next stage, publishing forecasts via HTML instead of PDF. This would make the forecasts more accessible on mobile, and reduce the overhead on forecasters for producing PDF files in various languages. Taking a very similar approach, the "Published" folder is re-used, instead of PDF files, forecast spreadsheets are moved here when they are ready to be published on the website. The software parses these sheets to extract only the relevant data, and renders the forecast as HTML, essentially using Google Drive like a CMS, to ammend a forecast one only needs to edit the spreadsheet!
From a technical perspective, the HTML rendering uses minijinja. Ideally I would have liked to have used something more type safe, but I needed something that would allow users of this application (other forecasting organizations) to customize the templates at runtime (to style the website according to their own requirements), and I also needed hot-reload support because Rust's lengthy compile times are not good for UI development workflow. Minijinja seemed like a worthy compromise, it has minimal dependencies and supports all the templating features required, and is easy to extend with new functions and filters, which I have done for things like localization.
Interaction on the website is mostly achieved through the use of hyperlinks, HTML forms, and HTMX, instead of using a more popular Javascript single page application framework (SPA) like React. This hearkens back to the older days of the internet when times were simpler, one could spin up a website with a few lines of PHP. This is for the most part, fundamentally a simple website, we present information to users on almost-static pages. Taking this approach has allowed me to implement most of this functionality on the backend in a single language (Rust). What little low latency client-only interaction we do need to support can be done with a couple of snippets of Javascript and simple self-contained libraries like leafletjs. My working theory is that for this kind of application there is simply no need to introduce the significant complexity associated with adopting a Single Page Application approach, nor does this team of 1 developer have the complexity budget available to adopt it. In a sense this project for me serves as a real-world experiment to test that hypothesis.
I also wanted to try using tailwindcss for applying styles to the HTML, as I had heard many good things about it, and it seemed well suited to go hand-in-hand with HTMX, everything about the page is defined in attributes. This worked out very well so far! A lot of effort was put into ensuring that the page scaled well on mobile screen formats.
As of this writing (November 2023), the plan is to complete a more professional looking website design before the season begins, with the ability for forecasters to edit content on the home page (such as announcements) without requiring a website re-deploy. We will again make use of the forecast spreasheet template to capitalize on the work done to create it, and retain flexibility if we wish to change it, however the long term goal is to eventually bring the data entry capability over to this server, making this software an all-in-one solution for avalanche forecasting.
You can check out our source code over at https://github.com/kellpossible/avalanche-report. I welcome any offers of collaboration and will gladly help anyone set up another forecasting region.
You can check out our forecast site at https://avalanche.ge/.